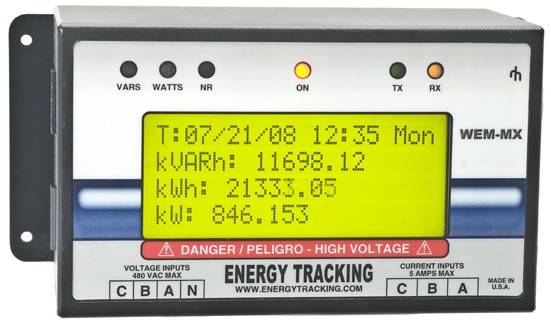
Web Enabled Meter:
Our Web Enabled Electric Meter (WEM-MX) is revenue grade compliant to ANSI C12.20 (0.2% accuracy). It is Internet enabled, broadband ready smart electric meter for commercial and industrial applications. It can be deployed as a primary meter, submeter or used for other electric metering applications such as energy usage tracking, demand reduction, power factor correction, etc. Besides tracking peak demand (kW) and energy consumption (kWh), this advanced meter integrates many important features and provides enhanced functionality such as automatic outbound reporting using 100% open protocols.
Its open system design facilitates world-wide deployment to populate applications with real time data based on accurate measurements. This electric meter is designed to meet requirements for data on demand from multiple users. Traditional meters focus only on single user applications at fixed time intervals.
It is the right solution in today’s complex energy markets combining low cost, high accuracy, minimum cost of communications with real time data access and reporting.
This sophisticated web enabled meter combines elements of simplicity, is highly functional and reduces overall ownership costs. Since most facilities already have an existing network, the cost of communication is virtually nil.
It has an embedded web server that can be accessed via MS IE web browser.
Please review WEM-MX Screen Shots & ET Analytics.
Load Profile And Peak Demand Capability:
This advanced meter provides peak demand (kW) with a date and time stamp informing you as to when the peak demand occurred. It also has the capability to periodically record and store interval data usage (load profile) based on a user defined interval of 1 minutes to 60 minutes or more. This functionality helps identify where, when and how much energy was consumed say, every 15 minutes. It can also store energy consumption by time-of-use (TOU). This allows end users to identify how much energy was consumed during different periods of the day. Configuration settings are done via its on board web server.
This smart meter can be used as a demand meter, time-of-use (TOU) meter or load profile meter - providing the right functionality for sub-metering, energy management and other metering applications such as demand reduction. Also, it boasts a wide variety of features like XML data encapsulation and broadband connectivity enabling it to transmit data via email, ftp or Web Service client. Reports can also be accessed via its web server or via ModBus TCP.
The optional supporting software applications include Enterprise Energy Tracking Analytics (ETA); a web portal cloud-based hosted solution that allows end users immediate and long term access to energy usage information and ET Real Time Mobile Application (ET-RTM) enabling an end-to-end solution from measurement to acquisition to energy management.
Standard Metering & Reporting Features:
- kW, kWh, kVARh, voltage, current, power factor, VA, frequency.
kWh & kVARh (Delivered, Received, Sum, Net - Instantaneous).
- Load Profile 4 Channels: kWh & kVARh (delivered and received).
- Configurable demand reset date and load profile logging interval.
- Internet connectivity via dynamically assigned IP address or static IP address.
- Email notification with cc: option.
- Data transfer via email, ftp, web server, Web Service client or ModBus TCP.
- FTP client - To send load profile, demand and consumption summary details.
- SNTP for time synchronization.
- Log-in to web server is authenticated.
- Data encapsulation format - XML.
- Programmable alpha-numeric meter ID and meter serial number.
- Programmable demand (kW) threshold. Meter sends email when exceeded.
- Programmable email/ftp (daily) reporting of peak demand, consumption and previous months energy usage.
- Programmable email/ftp reporting of load profile data at end of interval or at fixed intervals.
- Mail, ftp or Web Service reports include total kWh, last interval's kW, voltage, current, power factor values by phase and frequency.
- Mail, ftp or Web Service client reports can be setup to be sent every 1 minute or daily.
- 100% Open Protocols XML, HTTP, SMTP, SNTP, FTP, DHCP, DNS, SOAP, ModBus TCP.
Please review WEM-MX Screen Shots & ET Analytics.
Extended features include:
Energy Tracking's Internet enabled solid state ANSI C12.20 meter and its cloud based leading edge application ET Analytics can be applied to suite your specific needs. For pulse metering applications, the web enabled pulse logger WEPM will meet your needs and works with the ET Analytics as well.
Benefits And Value Proposition:
Energy Management:
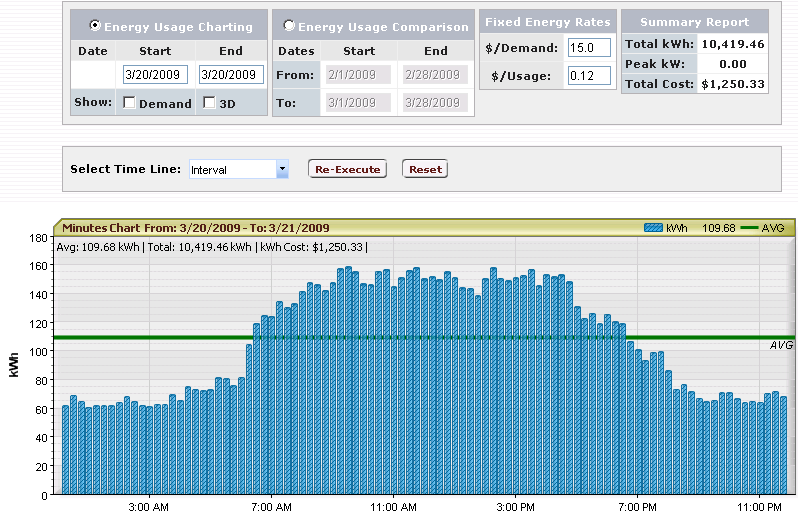
Get energy information right at your desktop. Access interval data, consumption, demand and more... ET Analytics shows the information in a chart and spreadsheet format, stores load profile and usage data and more.
ETA is an enterprise level energy management software web portal that automatically collects and manages valuable energy data and then translates the data into useful and actionable insights to users. ETA’s cloud-based robust data capture and analysis help users gain control over their energy costs via variety of interactive and automated energy analytics tools that are delivered via a convenient and easy to use web browser.
ETA manages large volumes of historical data from meters. It presents current data up to the last granular interval, hourly, daily, and monthly or yearly as well as historical data both in tabular and graphical form providing greater visibility and control of energy consumption.
ETA helps uncover hidden saving opportunities in complex energy environments.
Energy Tracking’s proven metering technology and global implementation to over 32 countries world-wide provides best-in-class data analytics capabilities and is an established leader in providing smart energy solutions to help improve operational efficiency, strategic energy management and provide greater visibility.
ETA’s value delivery framework with extensive energy domain expertise provides comprehensive strategic energy management solutions, cost tracking/reduction and more.
Data Sheet for ETA: Click Here.
SubMetering Applications:
Typical applications are: Sub meter building energy usage 24X7, renewable energy sources such as solar or wind, measurement and verification projects, tenant space, production / manufacturing energy usage.
Real Time Reporting:
This advanced electric meter is able to send data over the Internet using file transfer protocol (FTP), email, Web Service or can be accessed via its web server or ModBus TCP.
Load Curtailment Projects:
This smart meter is an ideal and proven product for Demand Response / Emergency Demand Reduction Programs.
Benefits:
- Better management of total energy usage.
- Get details about the amount and timing of your energy use, so you can adjust accordingly and save money.
- Load profile data provides 24X7 energy usage patterns.
- Identify and implement operational strategies to control load factor, peak load requirements and reduce energy waste.
- Understand and improve consumption patterns.
- Measure and verify anticipated energy savings from energy efficiency modifications.
- Highlight anomalies in electric / energy consumption. For example, a large night time increase may indicate that equipment is running unnecessarily.
- Identify and assess on a real time basis the fiscal impact of the energy consumption.
- Advanced notification via email of a higher peak demand being set.
- Instantaneous real time access to measurement and metered data via the Internet or local network.
Data can be used to:
- Track in real time energy usage, load, power factor and when your peak demand occurs.
- Identify and manage peak demand to avoid high utility bills.
- Create benchmarks and baselines to compare variation in energy usage over time.
- Correlate energy usage to costs.
- Reduce and limit the energy costs for your business.
- Validate the utility bill.
- Perform extremely accurate forecasting for budgeting purposes.
- Optimize energy usage and increase dollars to the bottom line.
Real Time Data Measurement And Reporting:
Nowadays, majority of buildings have a network already present. Our meter’s connection to a network is identical to that of a PC or laptop. There are 4 ways energy usage data can be accessed.
1. Connecting to the meter’s Web Server provides immediate access to data using MS IE Web Browser.
2. Meter can be set up to send reports periodically via email.
3. Meter can be set up to send reports periodically via ftp.
4. Meter can be set up to send reports periodically via web service.
5. Meter data can be accessed via ModBus TCP.
Acquiring data in real time from a network enabled meter has many advantages and provides significant benefits. Real-time data provides a greater understanding of the dynamic response characteristics of energy usage. Acquiring real-time data enables proactive management as after-the-fact does not help.
The most important is its ability to send frequent reports has no impact on communication costs, unlike the telephone-modem based meters. For example, load profile data can be dispatched every 1 minute.
Certain applications such as tenant billing only require once a month reporting which can also be setup in the meter, but knowing that you can generate or provide more frequent reporting has value in the sense that such reporting can prevent end of month ‘shock’ should energy usage go unexpectedly high. The meter can be setup to report to (cc:) tenants that would benefit from this.
If the meter sends an email warning of a peak demand threshold being crossed, you can take immediate action to avert this.
It is by far simpler and faster to use an Ethernet network than using a telephone dial up modem. Many corporations have an IT department and use their own software. The ability to easily interface with our meter over a network and capture data in XML or view data using a standard web browser such as MS IE provides additional value.
Energy Usage Analysis:
Using the interval logging capabilities of our meter, you can identify where, when and how much energy is used over time. You can chart and print energy consumption by months, weeks, days, hours or sub intervals.
You can identify when the highest peak demand occurred and the time at which it occurred.
You can compare energy consumption on various days to identify anomalies and review changes in operation. You can also perform kWh v/s kVARh, kW v/s kWh analysis or compare energy usage of multiple sites.
Billing Analysis:
Our ET Analytics application has a tariff module which allows you to enter energy and demand costs for weekdays, weekend and holidays. You can then generate and print a bill based on the tariff.
| Company | Solutions | WEPM Pulse Data Logger | ET Analytics | WEM-MX Screen Shots & ET Analytics. | Latest News | Reports | Overview | Applications
|

|
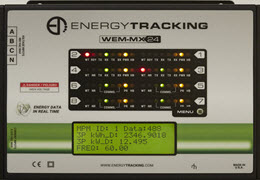
WEM-MX-24 5th Gen
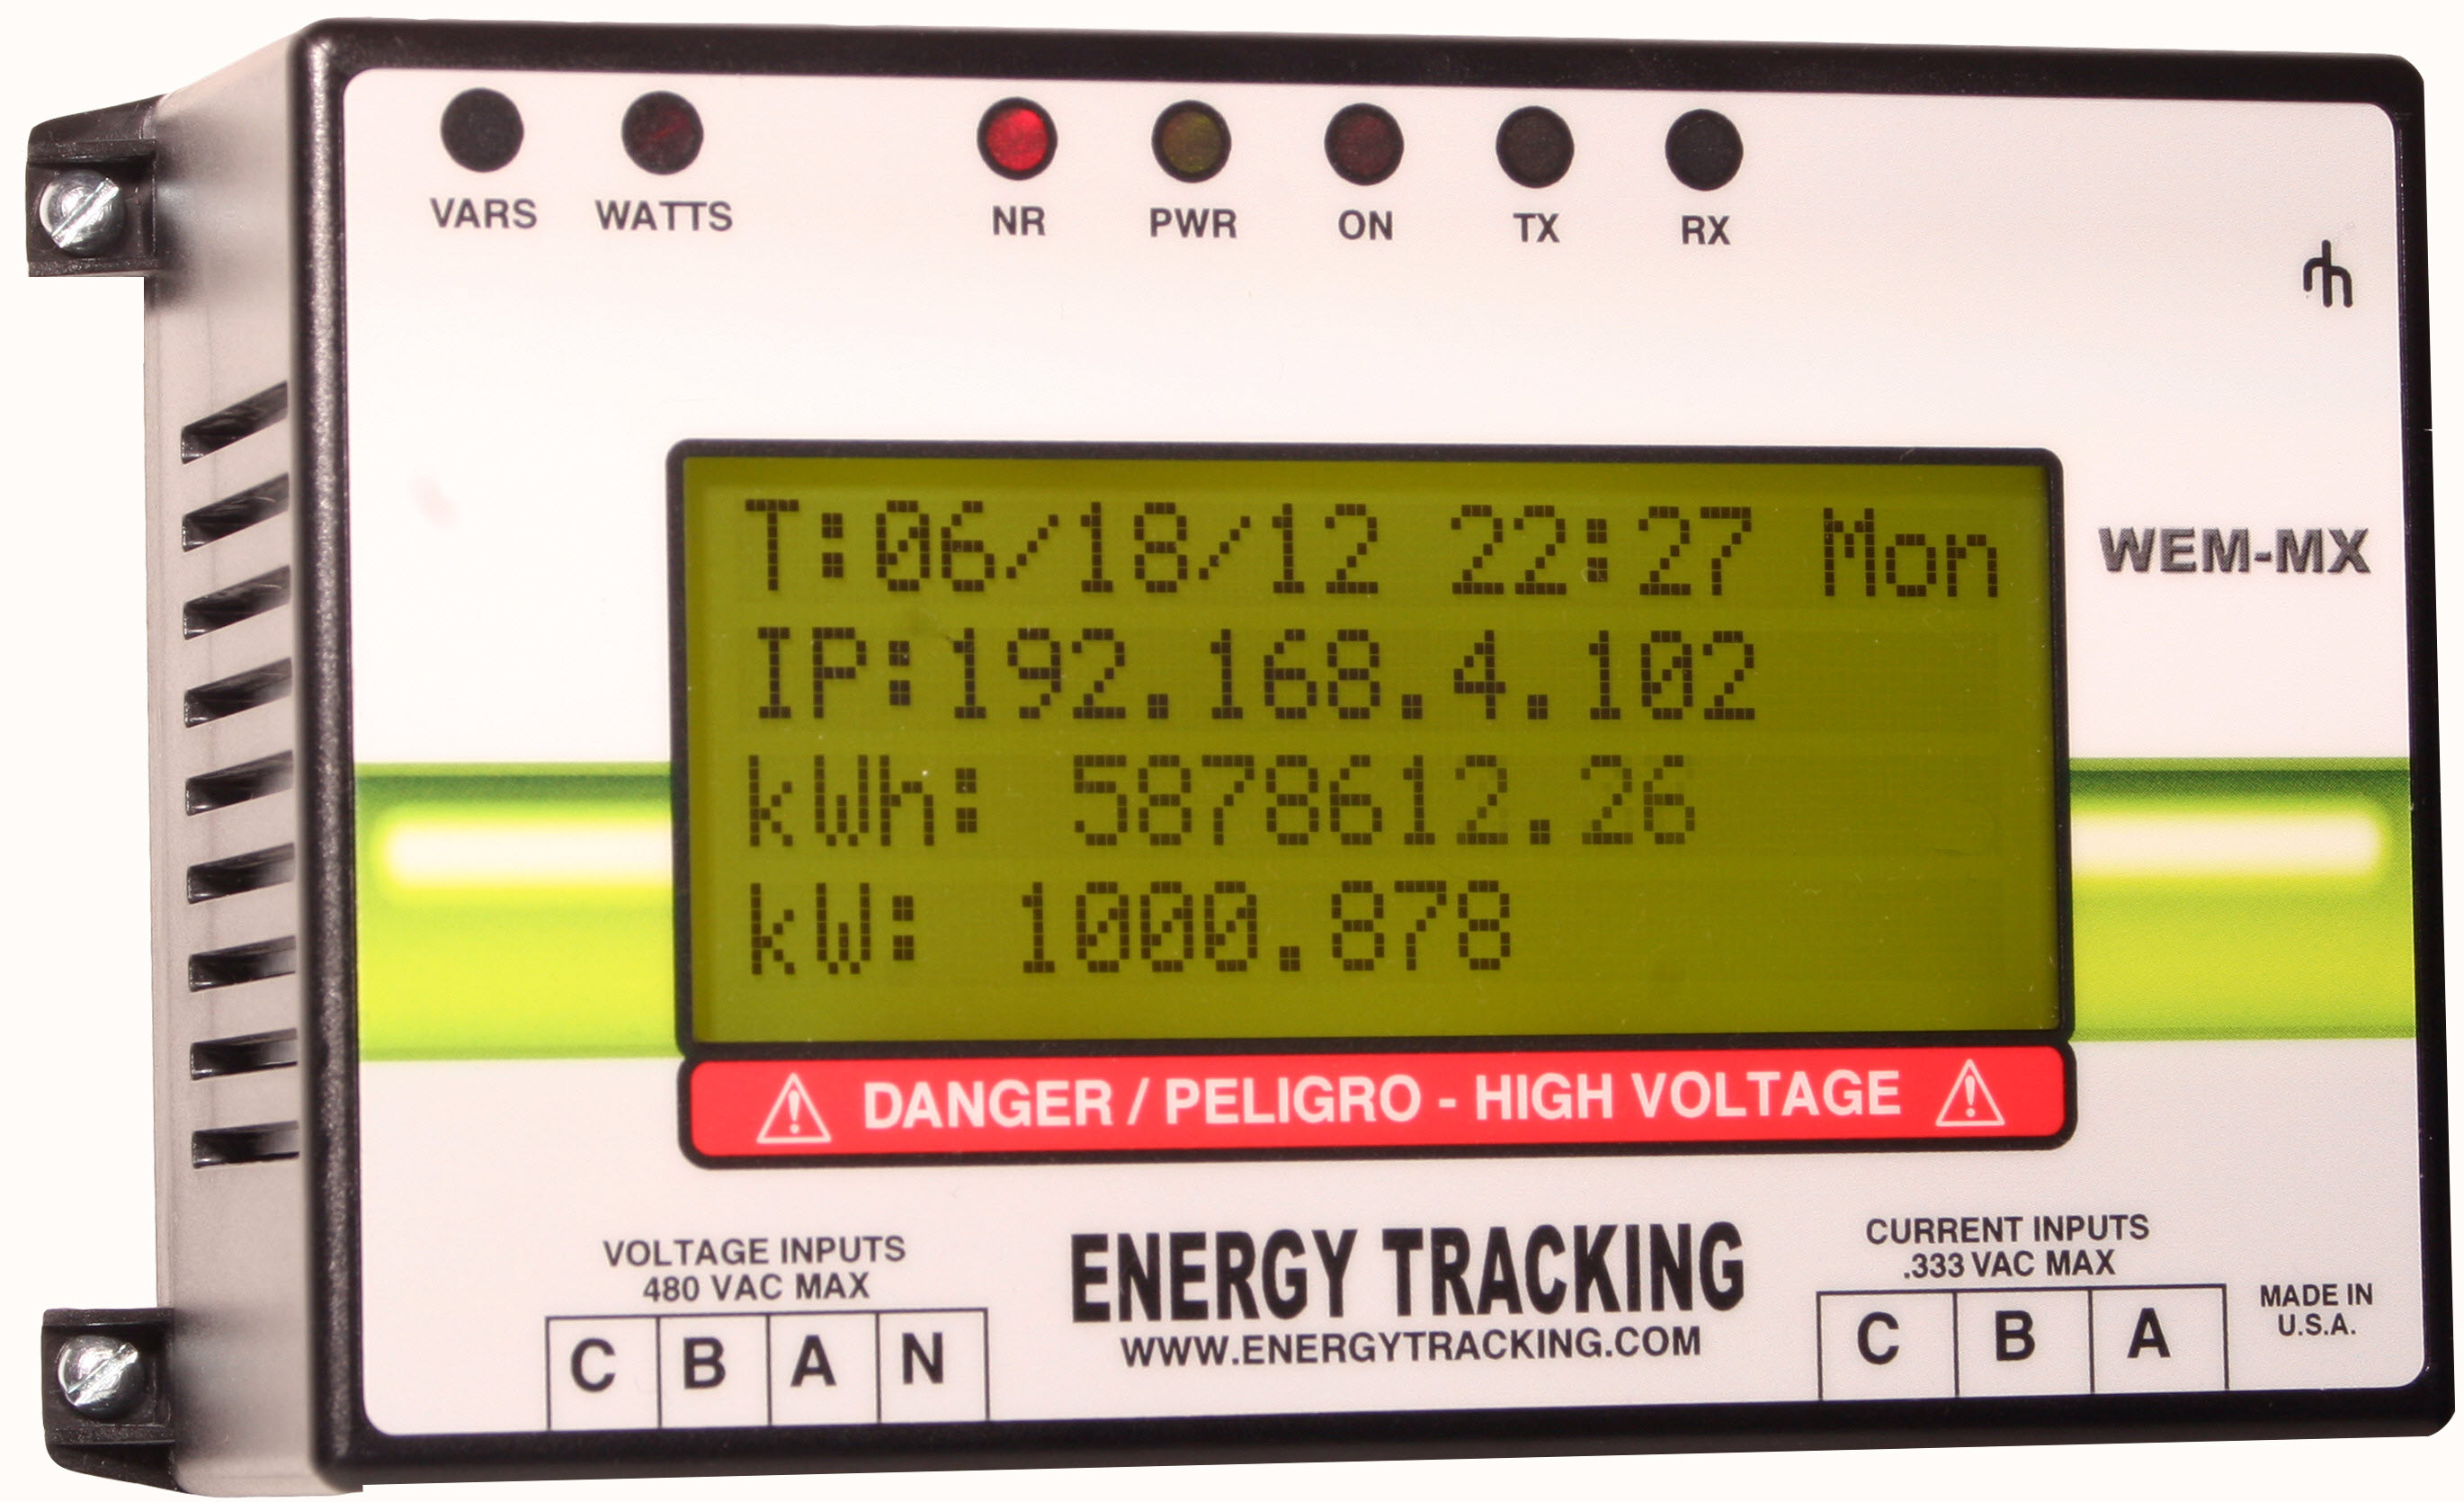 WEM-MX 333mV 4th Gen
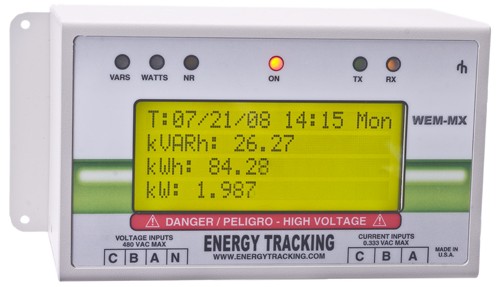 WEM-MX 333mV 3rd Gen
WEM-MX 5A 2nd Gen


Certifications
|