| |
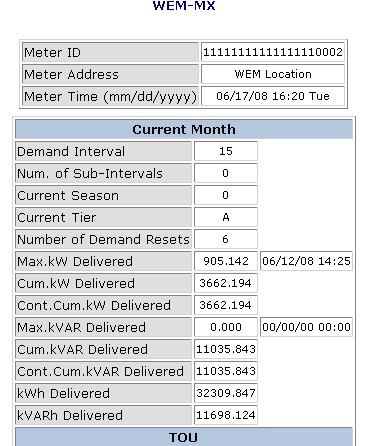
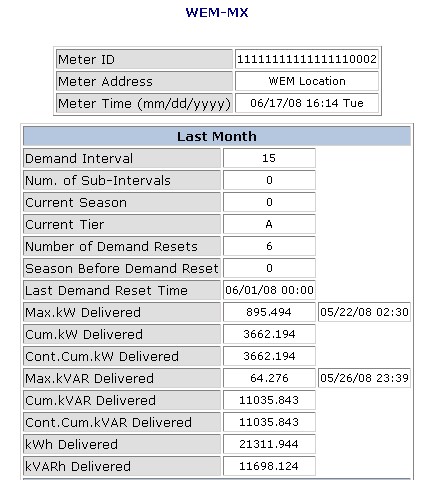
The WEM-MX reports commonly required data such as kW, kWh, kVarh and much more.
The WEM-MX is a bi-directional meter and measures energy flow in both direction.
Due to this reason, you will see the words "Delivered" and "Received" after kW, kWh and kVArh.
The meaning of "Delivered" is energy delivered (imported) from the utility grid to the facility and "Received" is energy received (exported) to the grid.
The peak demand kW (Max. kW) as well as the time at which the peak demand occurred is also provided. This information can be viewed
by accessing the MX’s internal web server and is also provided by the meter via email, FTP or Web Service which also includes voltage,
current, power factor by phase, load profile data and consumption since last demand reset.
| Current Month |
| |

|
| |
| Last Month |
| |

|
| |
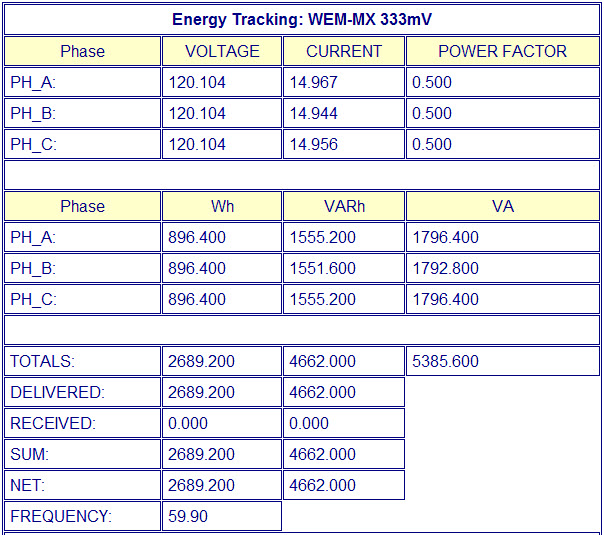
| The WEM-MX meter provides real time energy usage data such as voltage, current, power factor, watt hours, var hours, VA and frequency. |
| Real-Time Data Updated Every 1 Second |
| |

|
| |
| Load Profile Data Interval Can Be 1 to 60 Minutes |
| Time (mm/dd/yyyy) | kWh_Del | kWh_Rec | kVarh_Del | kVarh_Rec |
| 12/08/2007 03:30:00 | 175.76 | 0.0 | 11.24 | 0.00 |
| 12/08/2007 04:00:00 | 14.39 | 0.0 | 0.92 | 0.00 |
| 12/08/2007 04:30:00 | 51.55 | 0.0 | 3.30 | 0.00 |
| 12/08/2007 05:00:00 | 12.31 | 0.0 | 0.79 | 0.00 |
| 12/08/2007 05:30:00 | 18.22 | 0.0 | 0.89 | 0.00 |
| 12/08/2007 06:00:00 | 33.44 | 0.0 | 1.67 | 0.00 |
| 12/08/2007 06:30:00 | 47.81 | 0.0 | 1.82 | 0.00 |
| 12/08/2007 07:00:00 | 180.90 | 0.0 | 11.31 | 0.00 |
| 12/08/2007 07:30:00 | 243.48 | 0.0 | 12.24 | 0.00 |
| 12/08/2007 08:00:00 | 336.25 | 0.0 | 16.39 | 0.00 |
| 12/08/2007 08:30:00 | 332.14 | 0.0 | 16.84 | 0.00 |
|
